anti p pak1 s144 p pak2 s141 (Cell Signaling Technology Inc)
95
Structured Review
Cell Signaling Technology Inc
anti p pak1 s144 p pak2 s141
Anti P Pak1 S144 P Pak2 S141, supplied by Cell Signaling Technology Inc, used in various techniques. Bioz Stars score: 95/100, based on 189 PubMed citations. ZERO BIAS - scores, article reviews, protocol conditions and more
https://www.bioz.com/result/anti p pak1 s144 p pak2 s141/product/Cell Signaling Technology Inc
Average 95 stars, based on 189 article reviews
anti p pak1 s144 p pak2 s141 - by Bioz Stars,
2026-03
95/100 stars
Images
1) Product Images from "Gravitational and mechanical forces drive mitochondrial translation through the cell adhesion–FAK axis"
Article Title: Gravitational and mechanical forces drive mitochondrial translation through the cell adhesion–FAK axis
Journal: bioRxiv
doi: 10.1101/2023.01.18.524628
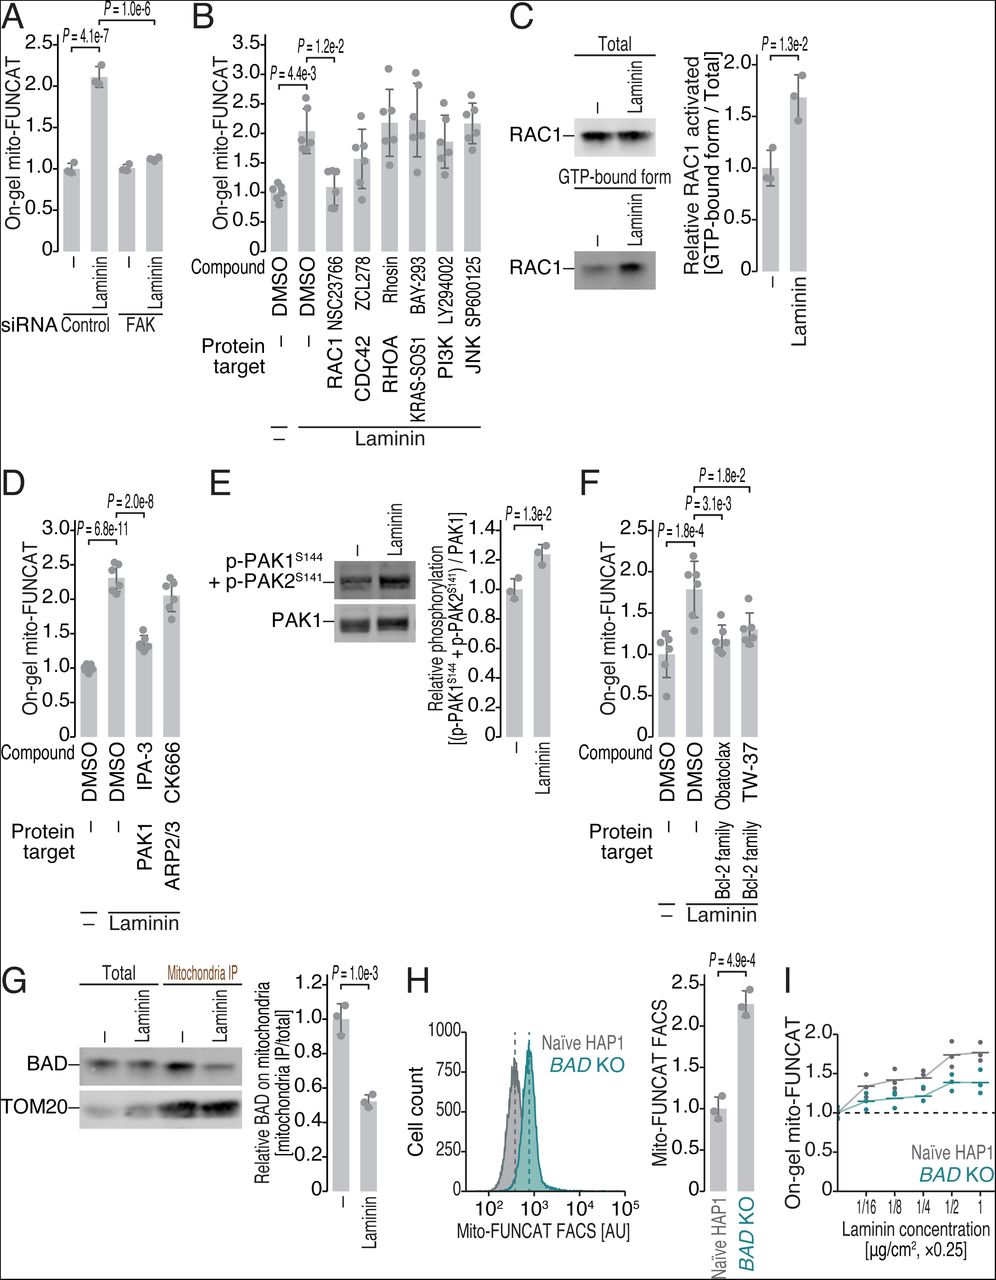
Figure Legend Snippet: (A) On-gel FUNCAT experiments to monitor mitochondrial translation with siRNA transfection to knock down FAK. (B, D, and F) On-gel FUNCAT experiments to monitor mitochondrial translation under treatment with the indicated compounds at the following concentrations for 12 h: NSC23766, 200 μM; ZCL278, 100 μM; Rhosin, 50 μM; BAY-293,1 μM; LY294002, 10 μM; SP600125, 20 μM; IPA-3, 5 μM; CK666, 25 μM; obatoclax, 2 μM; TW-37, 10 μM. (C) Western blotting of RAC1 protein in the total cell lysate and in the GTP-bound fraction pulled down with the p21-binding domain (PBD) of PAK1. The quantified relative amount of RAC1 in the GTP-bound, activated form is shown. (E) Western blotting of total PAK1 protein and the phosphorylated form (at S144 and S141). The quantified relative amount of phosphorylated PAK1 is shown. (G) Western blotting of total BAD protein in the total lysate and in the mitochondria immunoprecipitated (IP) fraction with anti-TOM22 antibody. (H) Representative distribution of Cy3-conjugated HPG signals normalized to AF647-labeled TOMM20 signals in the indicated cell lines (left). The dashed line presents the mean of the distribution. The quantification is shown on the right. The distribution of unnormalized Cy3-conjugated HPG signals and AF647-labeled TOMM20 signals are shown in . (I) On-gel FUNCAT experiments to monitor mitochondrial translation in naïve and BAD KO HAP1 cells with a titrated concentration of laminin pretreatment. For A-H, data from replicates (points, n = 3 for A, C, E, G, and H; n = 6 for B, D, and F), the mean values (bars), and the s.d.s (errors) are shown. The p values were calculated by Student’s t test (two-tailed) (C, E, G, and H) and by the Tukey‒Kramer test (two-tailed) (A, B, D, and F). For I, data from three replicates and the mean values (bars) are shown. See also .
Techniques Used: Transfection, Knockdown, Western Blot, Binding Assay, Immunoprecipitation, Labeling, Concentration Assay, Two Tailed Test